

Overview
Quo Analytics provides comprehensive insights into your team’s communication patterns and performance. Track call and text volume, identify peak activity times, monitor team performance, drill into charts to see the activity behind a metric, and export detailed reports for deeper analysis.Accessing analytics
Getting to the dashboard
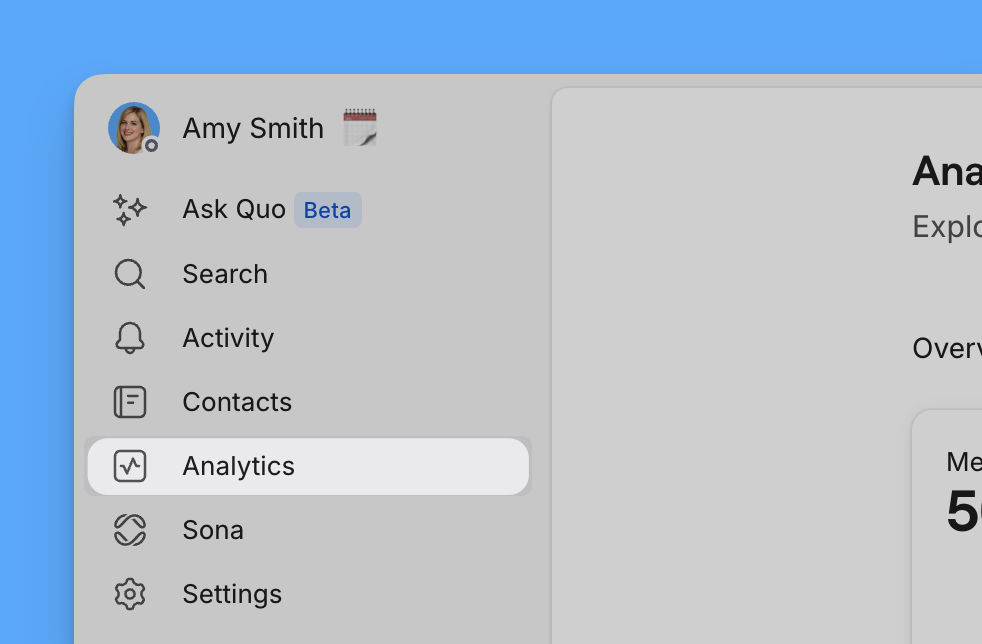
To view analytics:- Click Analytics in the left sidebar (web and desktop only)
- Select time period and filters
- Review metrics and export data as needed
- Available on web and desktop applications
- Mobile app support coming soon
Analytics dashboard overview
Calls and messages, together
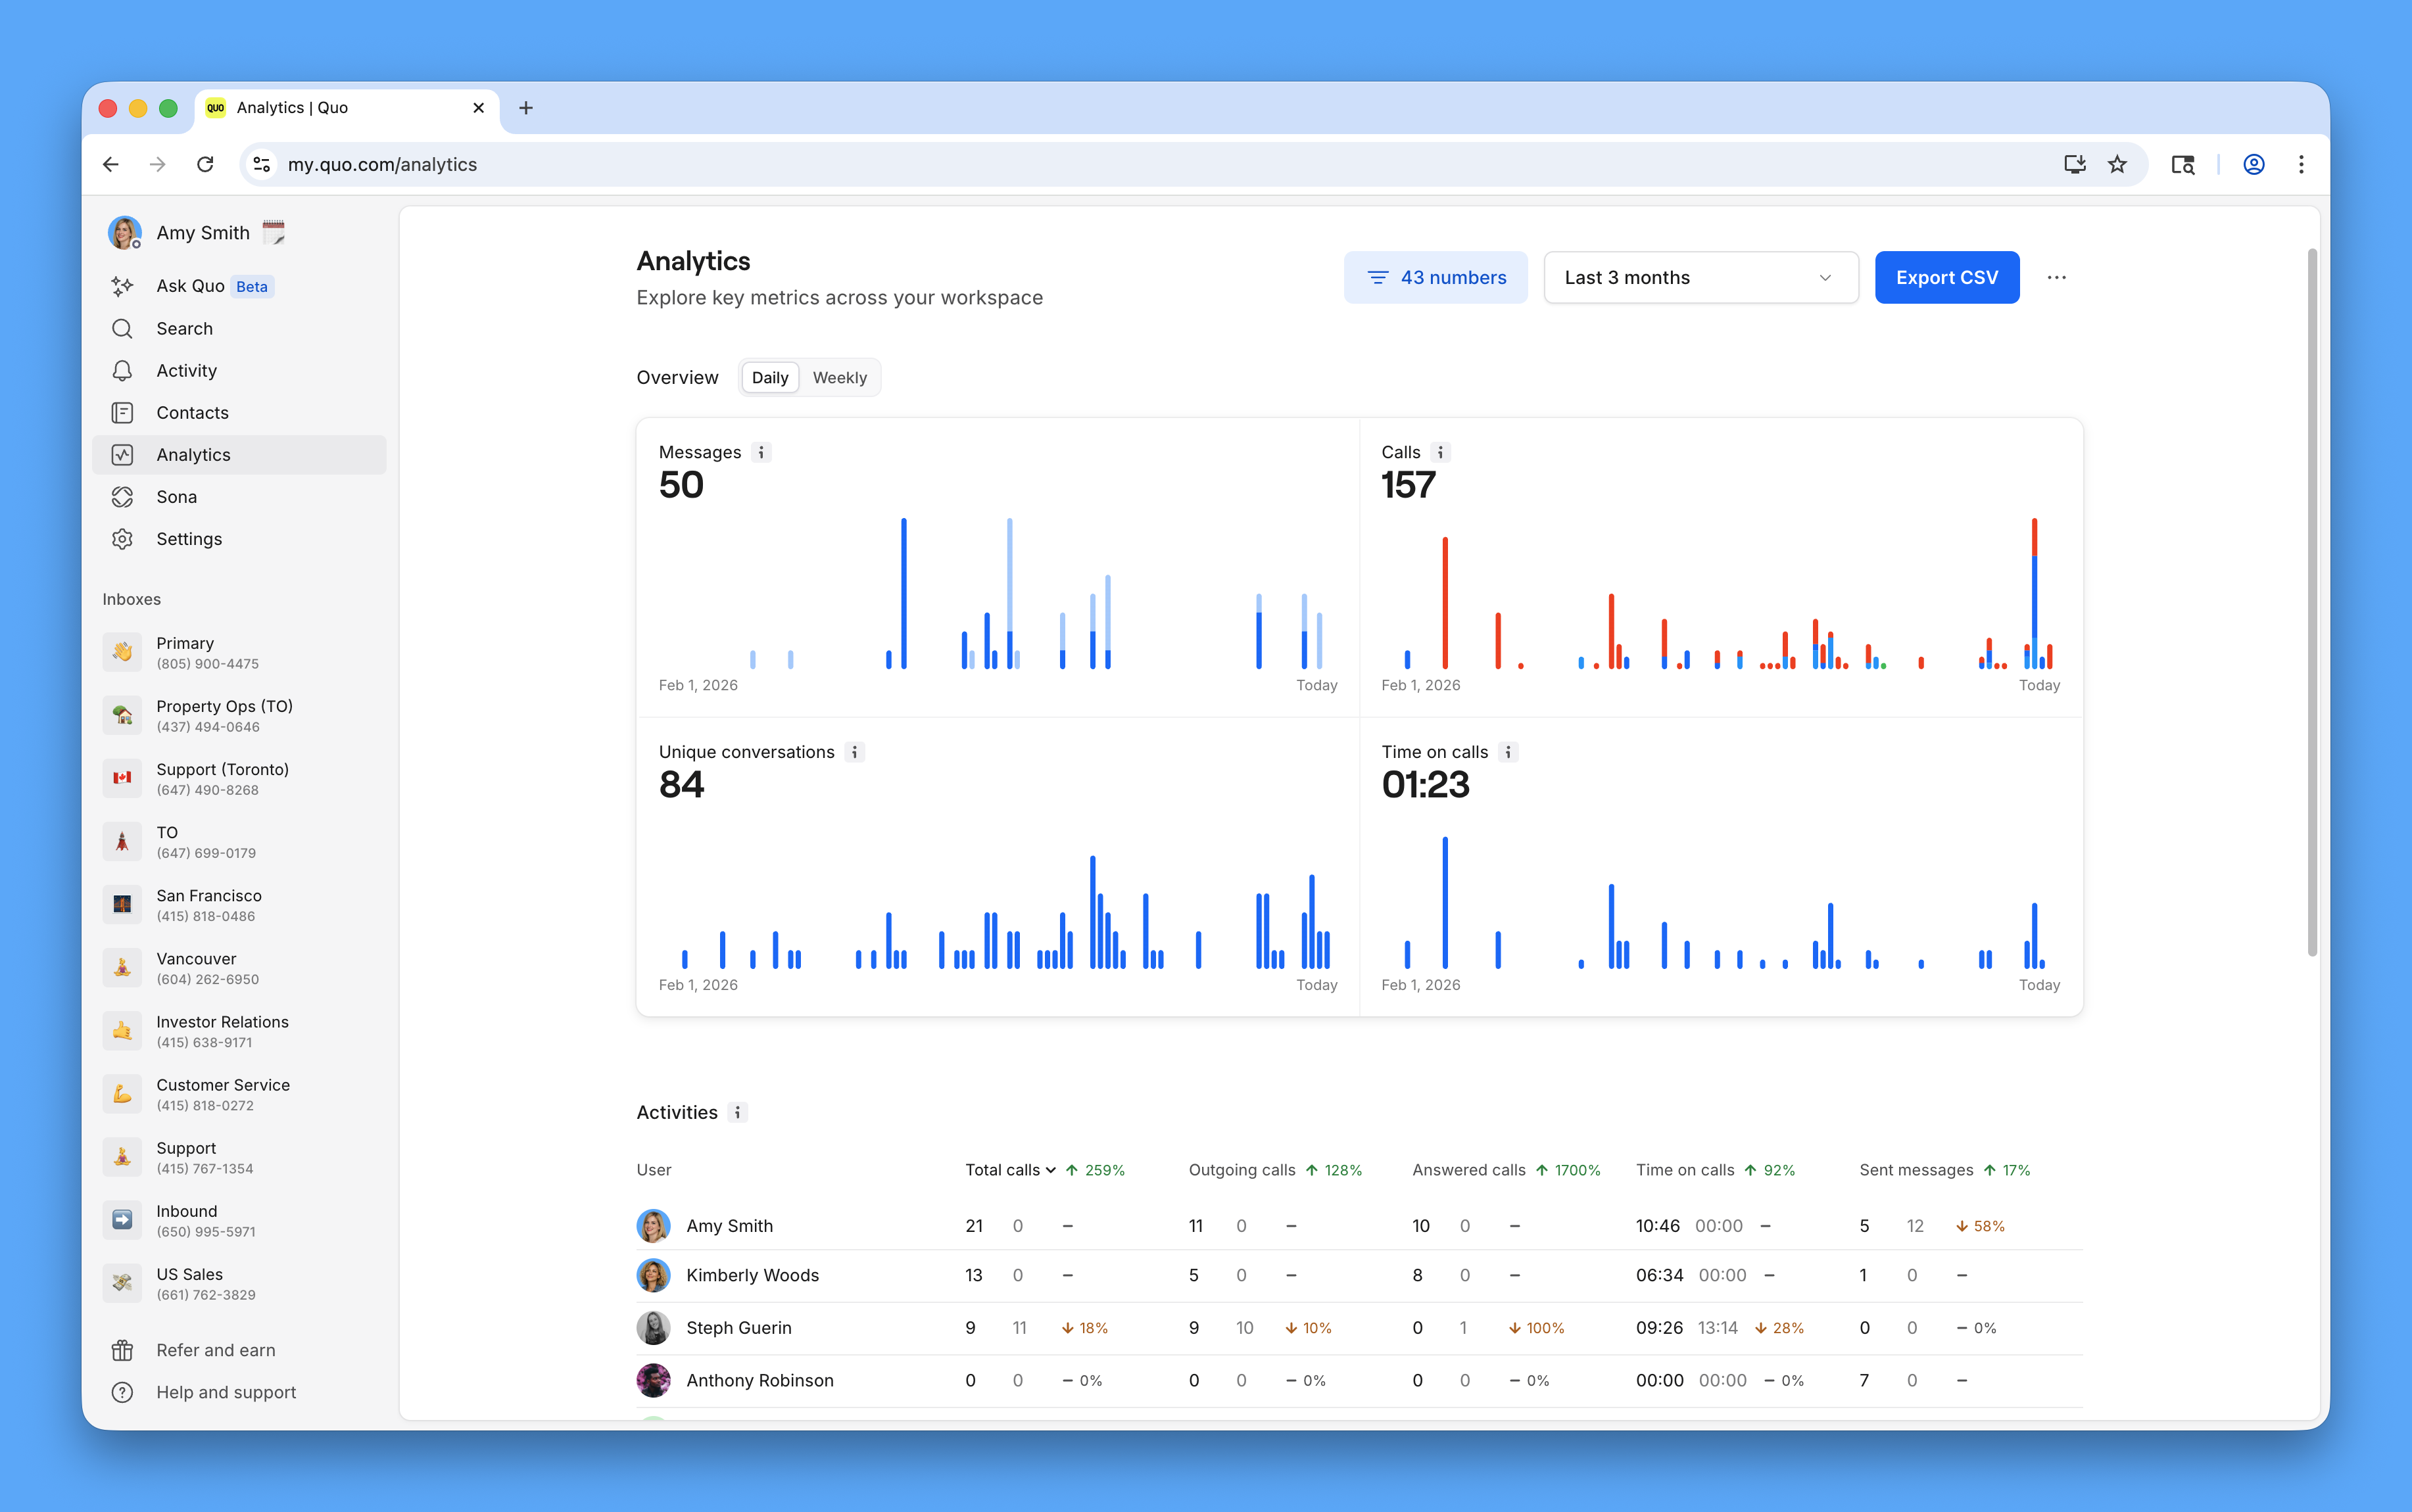
Calls and messages now appear in a single section, with incoming activity on the left and outgoing activity on the right. This makes it easier to compare volume and spot patterns, like whether a spike in incoming calls lines up with a dip in outgoing messages, without switching between separate reports.Key metrics displayed
Summary statistics:- Incoming and outgoing call outcomes, broken down by type
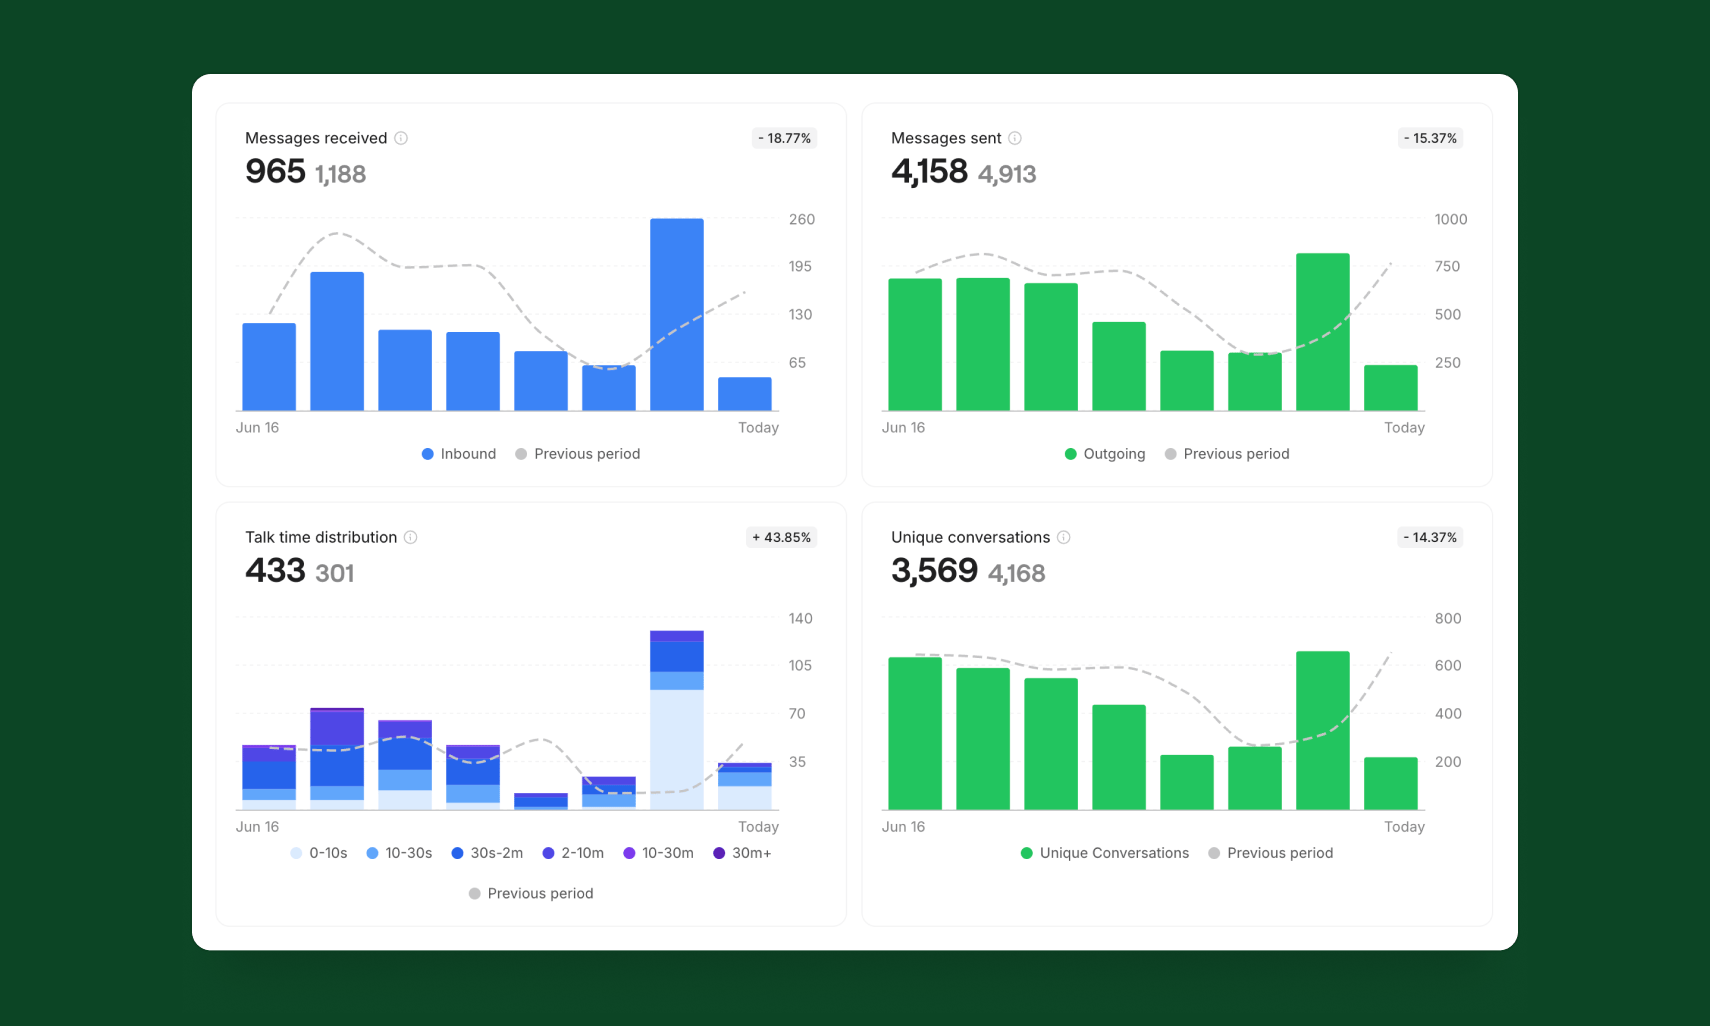
- Messages sent and received
- Unique conversations
- Talk time distribution, with calls grouped by length
Team performance breakdown
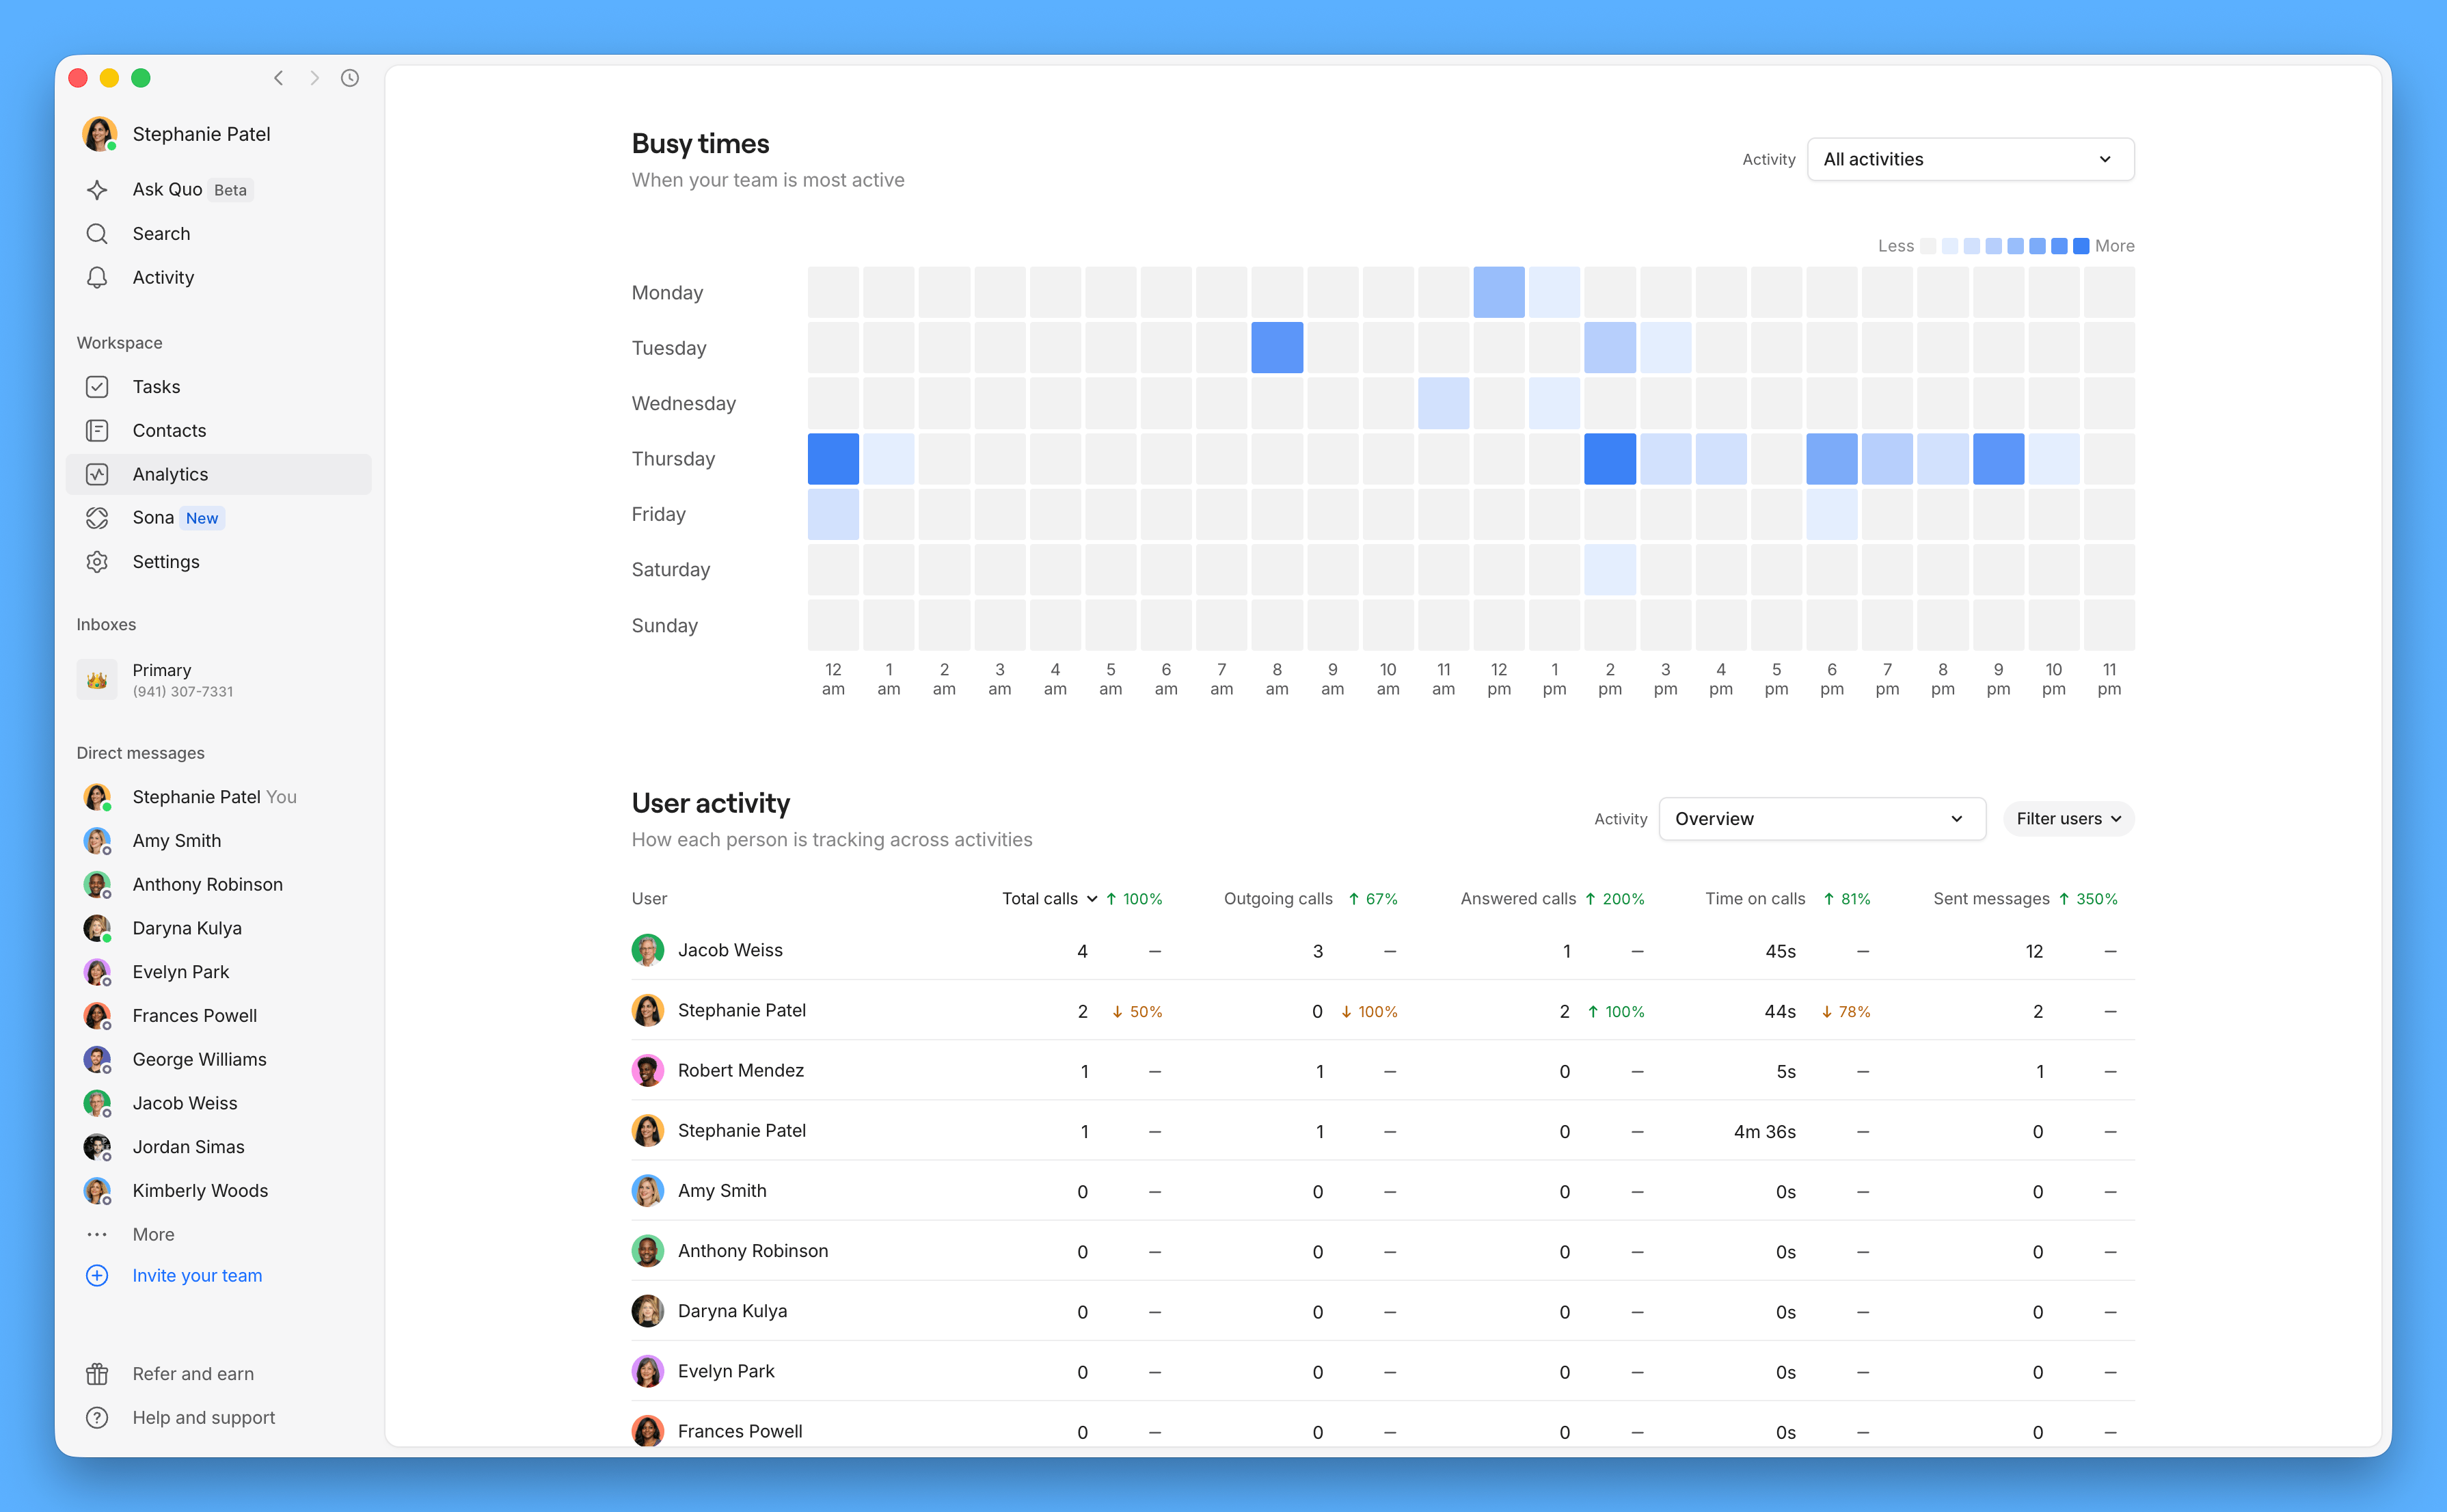
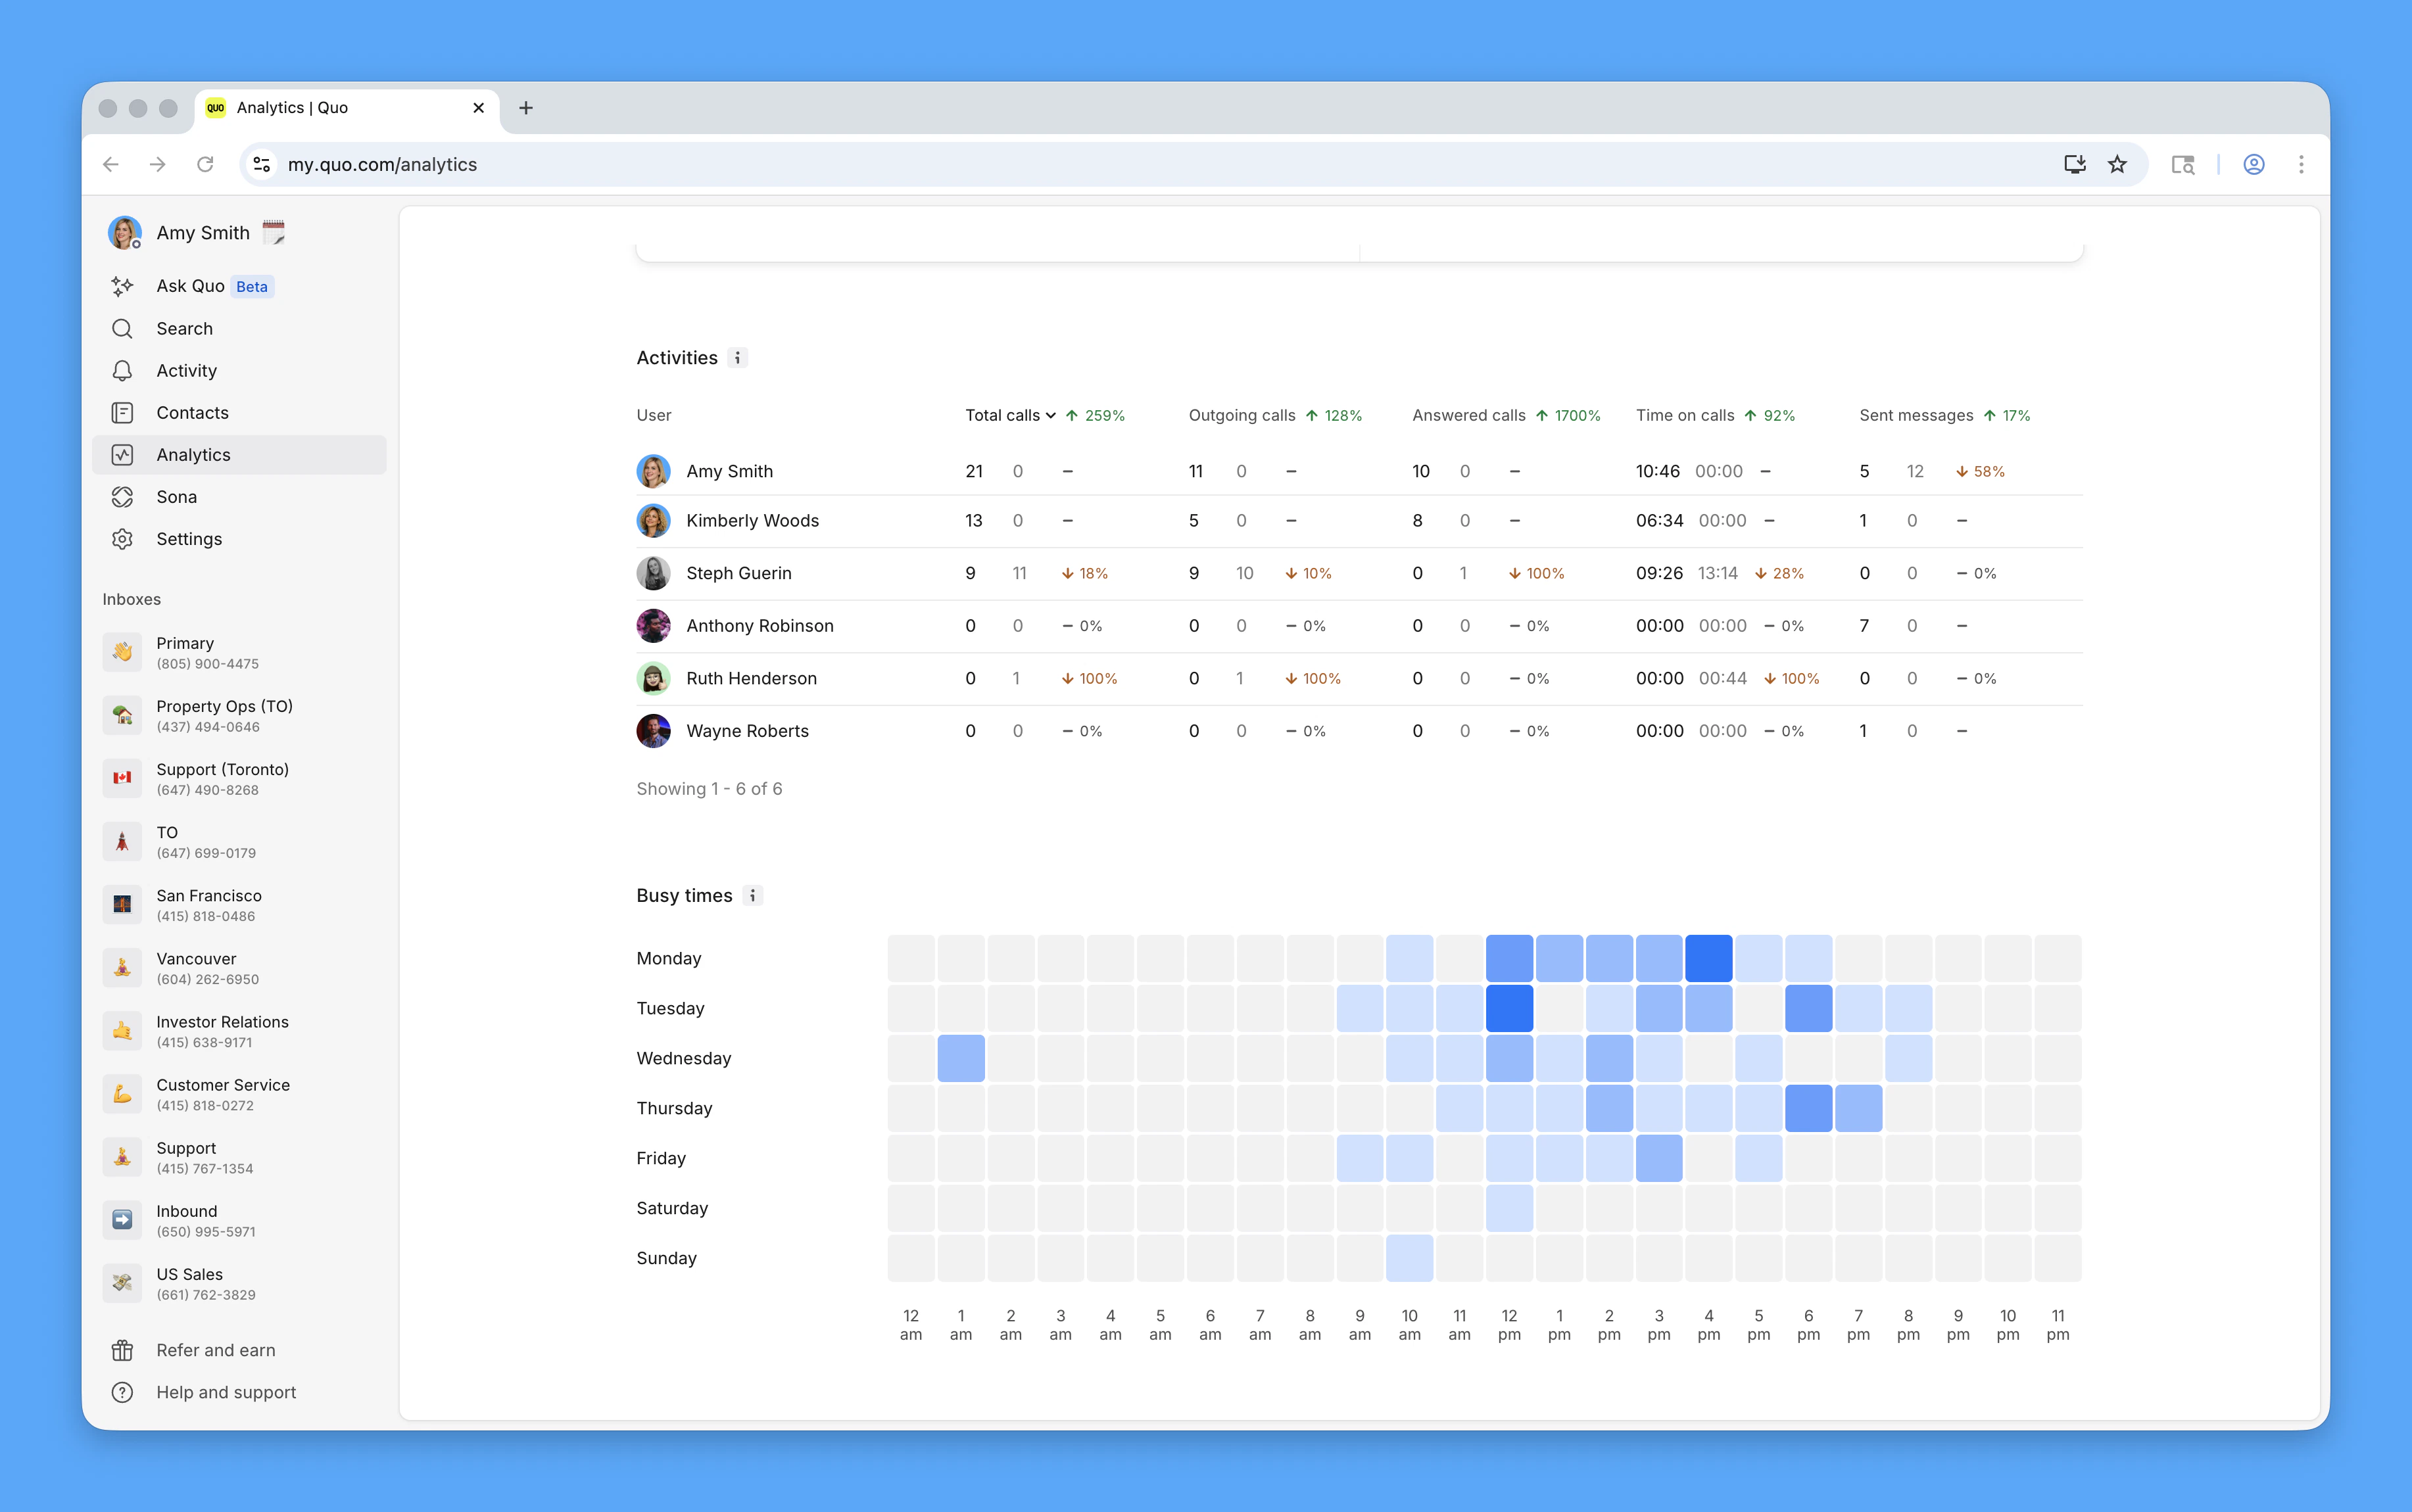
User activity analysis:- Individual team member call, message, and conversation volumes, each with a percentage change against the previous period
- Performance comparisons across team
- Activity trends over selected time periods
- Filter the table to all activity, calls only, or messages only
Activity heat map
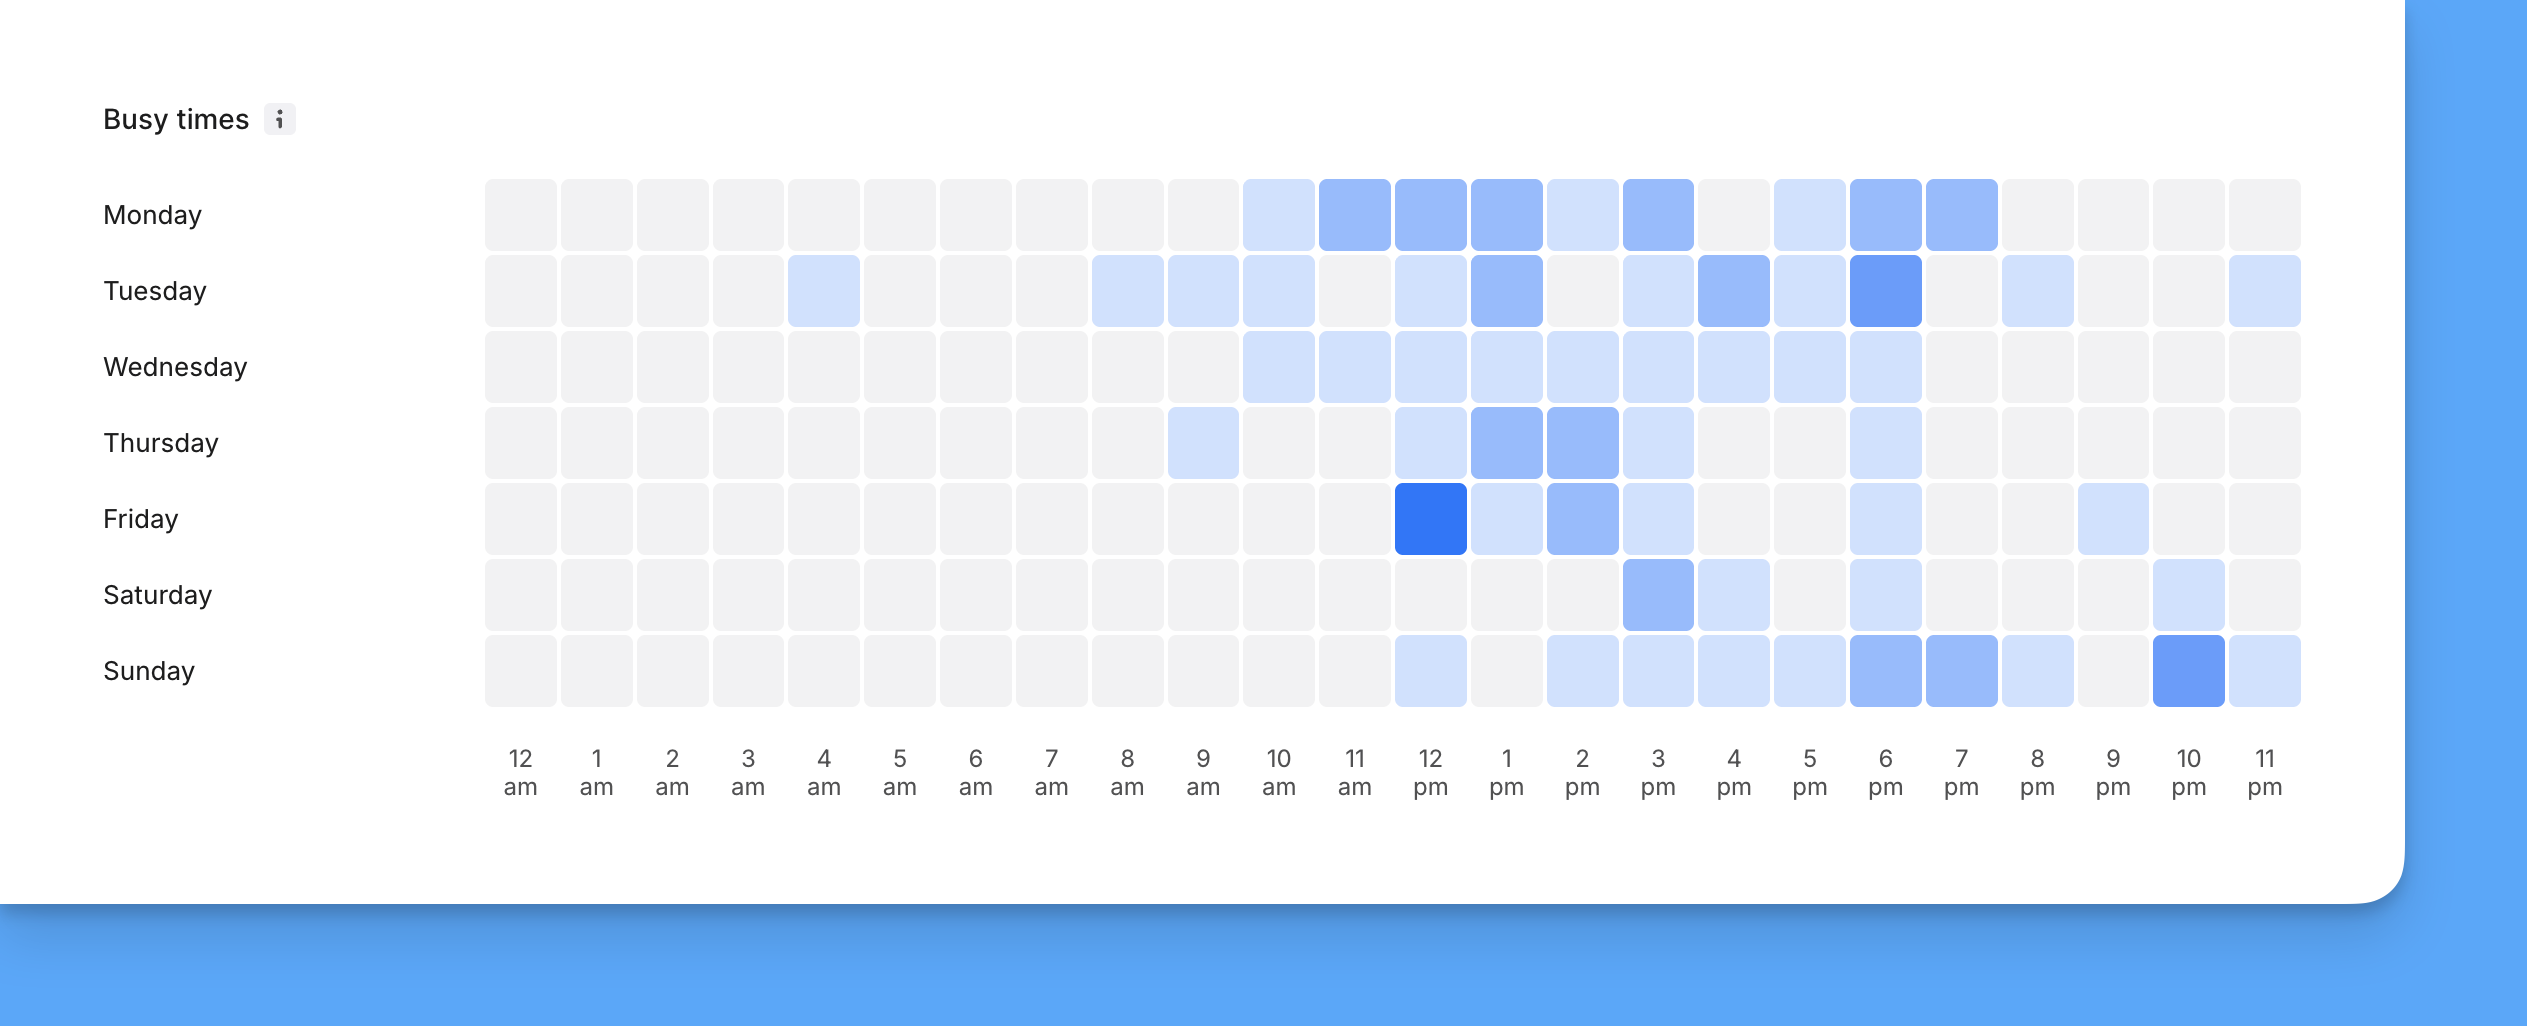
Peak activity identification:- Visual representation of busiest times by day and hour
- Filter by call activity, message activity, or both to see peak times for a specific channel
- Helps optimize team scheduling and coverage
- Identifies communication patterns
Talk-time distribution
In addition to total time on calls, the dashboard breaks calls down by how long each call lasted:- 0–10 seconds (typically misdials or immediate hangups)
- 10–30 seconds
- 30 seconds – 2 minutes
- 2 – 10 minutes
- 10 – 30 minutes
- 30+ minutes+
AI call tags
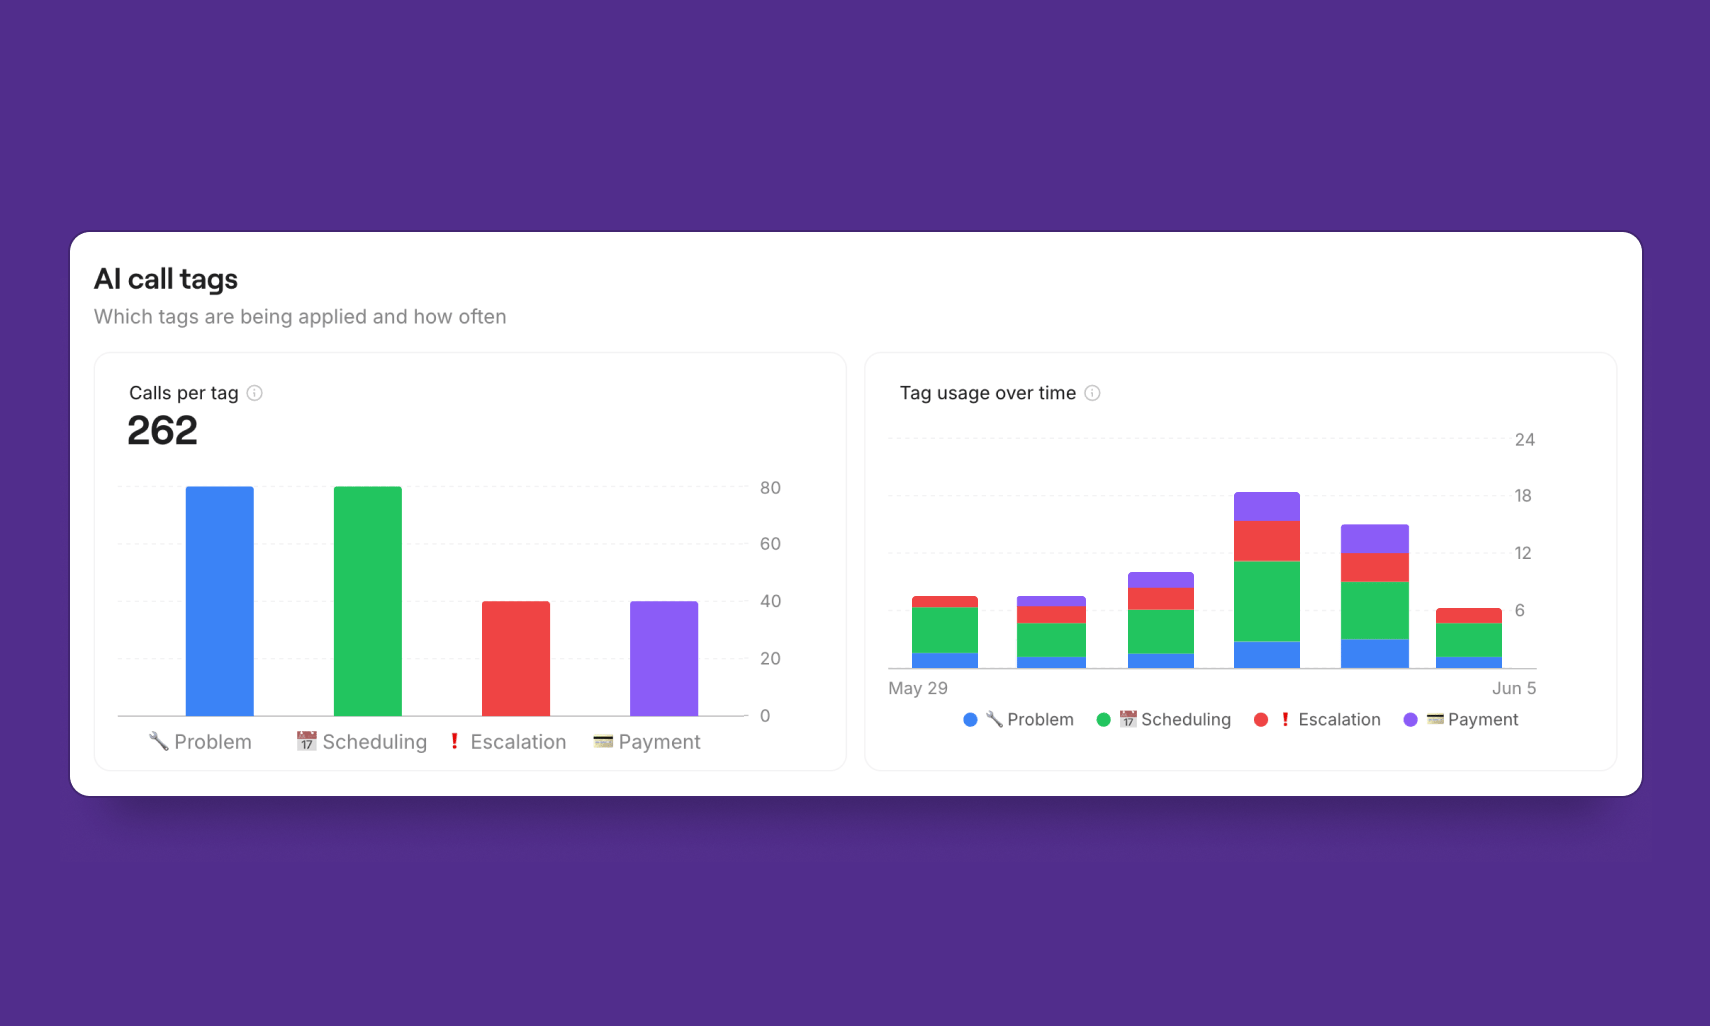
If your workspace uses AI call tags, Analytics surfaces tag volume directly in the dashboard:- See which tags are applied most often across the selected time range
- Compare tag volume trends over time
- Click into a tag to see the underlying calls
Agent vs. teammate attribution
Calls handled by AI agents are reported separately from calls handled by teammates, so workload and outcome metrics aren’t mixed together. Filter the dashboard to one or the other to see where AI is deflecting volume and where your team is spending its time.Filtering and customizing data
Available filter options
Time period filters:- Predefined ranges: Today, yesterday, last 7 days, 4 weeks, 3 months, 12 months
- Business periods: Month-to-Date (MtD), Quarter-to-Date (QtD), Year-to-Date (YtD)
- Custom date range selection
- Day view for detailed daily patterns
- Week view for broader trends
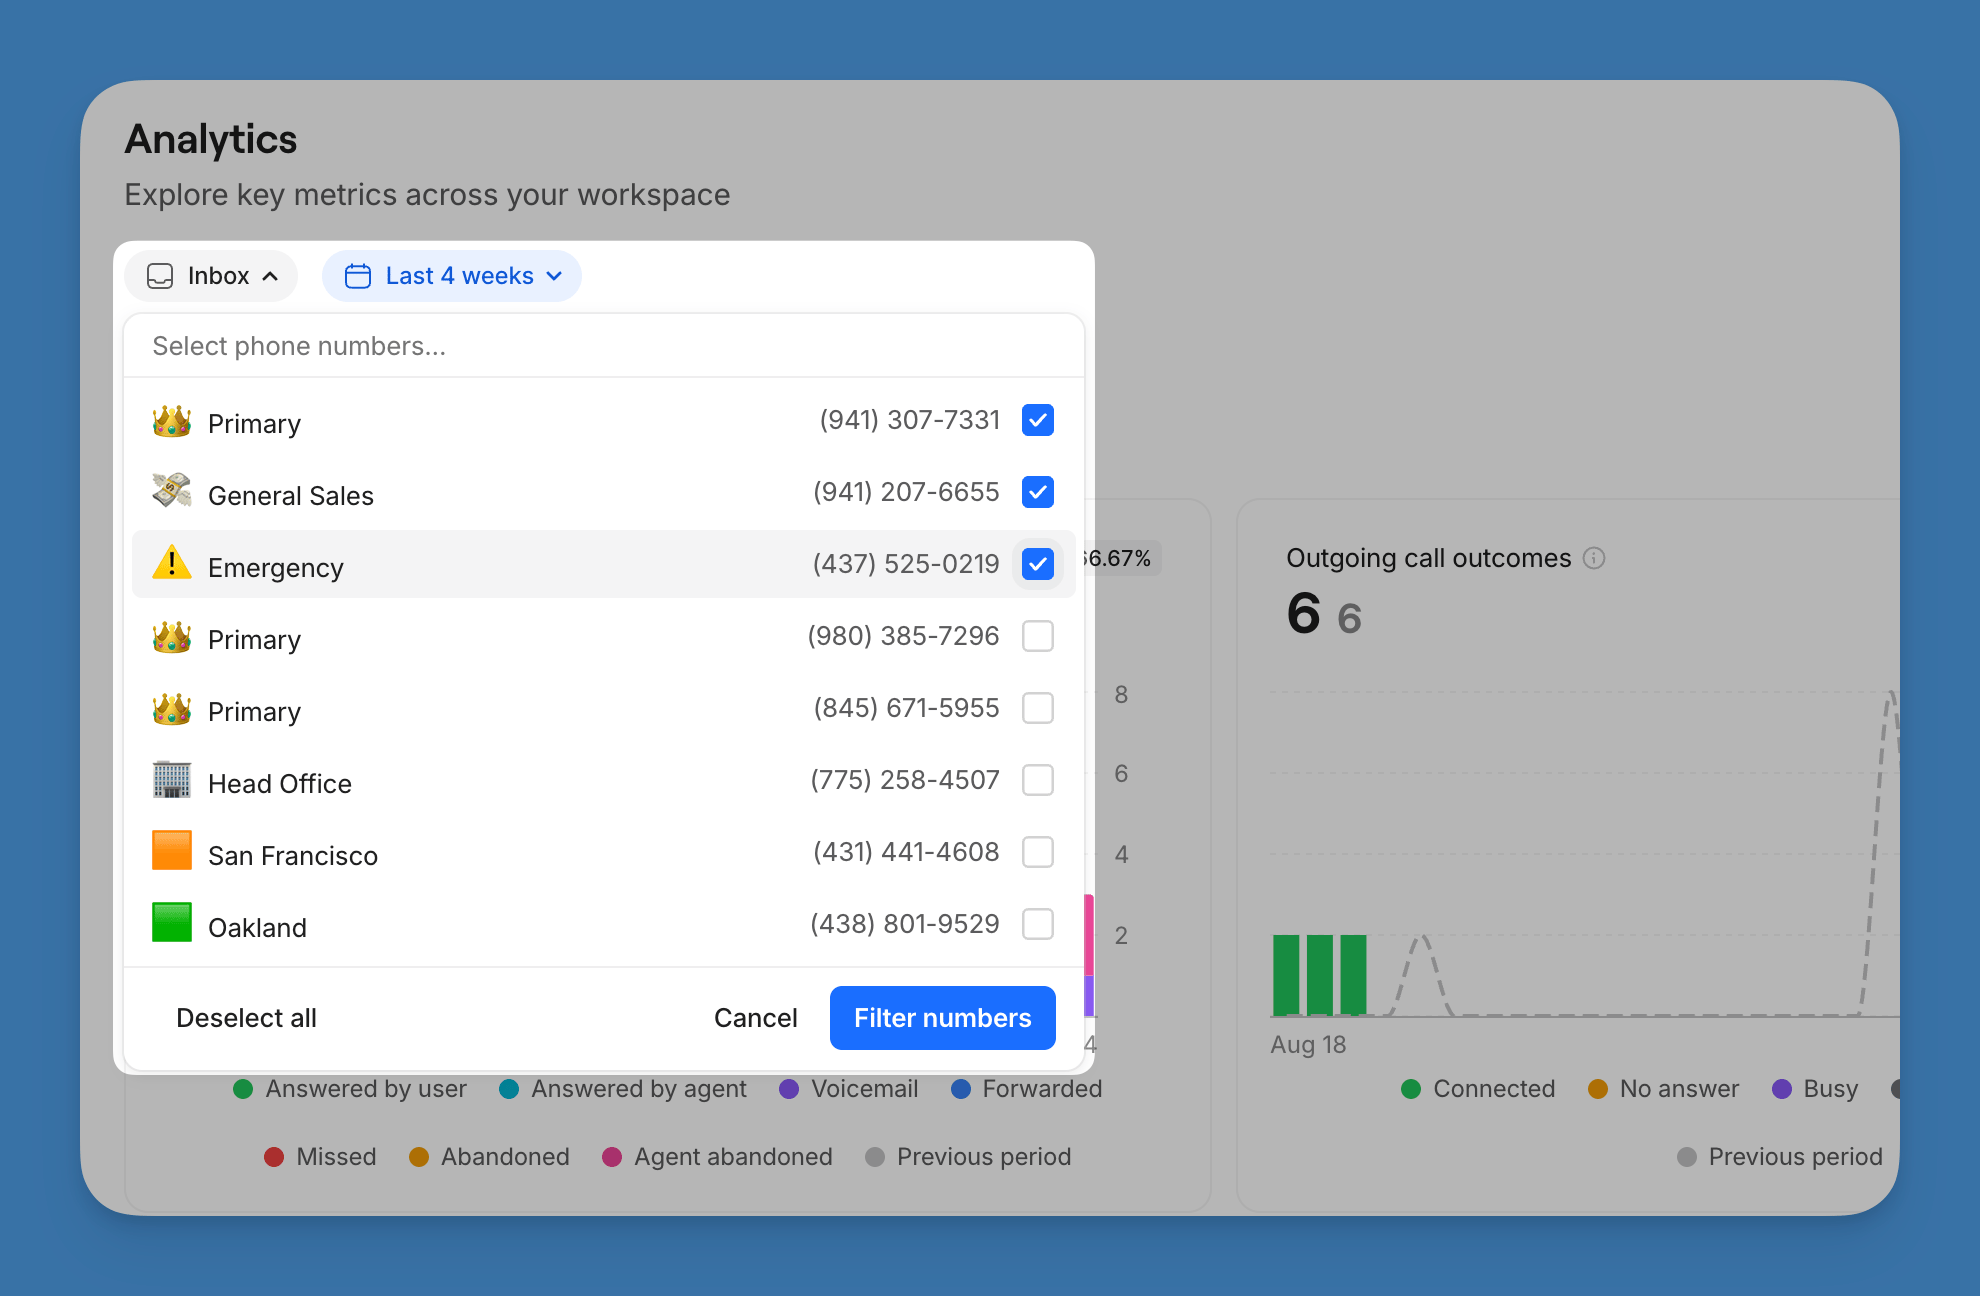
- Filter by specific phone numbers
- Analyze individual number performance
- Compare performance across different numbers
Data export and reporting
CSV export process
To export analytics data:- Apply desired filters and time range
- Click Export CSV in upper right corner
- Report will be emailed to your Quo account email
- Download and analyze in spreadsheet application
Export data points
Included in CSV exports (24+ data points):- Team member assignment for calls and messages
- Call duration and timing details
- Caller and message sender phone numbers
- Timestamp information for all activities
- Status breakdowns for calls, messages, and voicemail
- Direction indicators (incoming vs outgoing)
Understanding status indicators
Call outcome definitions
Analytics classifies every call by what actually happened, not just whether it connected. Incoming and outgoing calls use different outcome sets because the failure modes are different.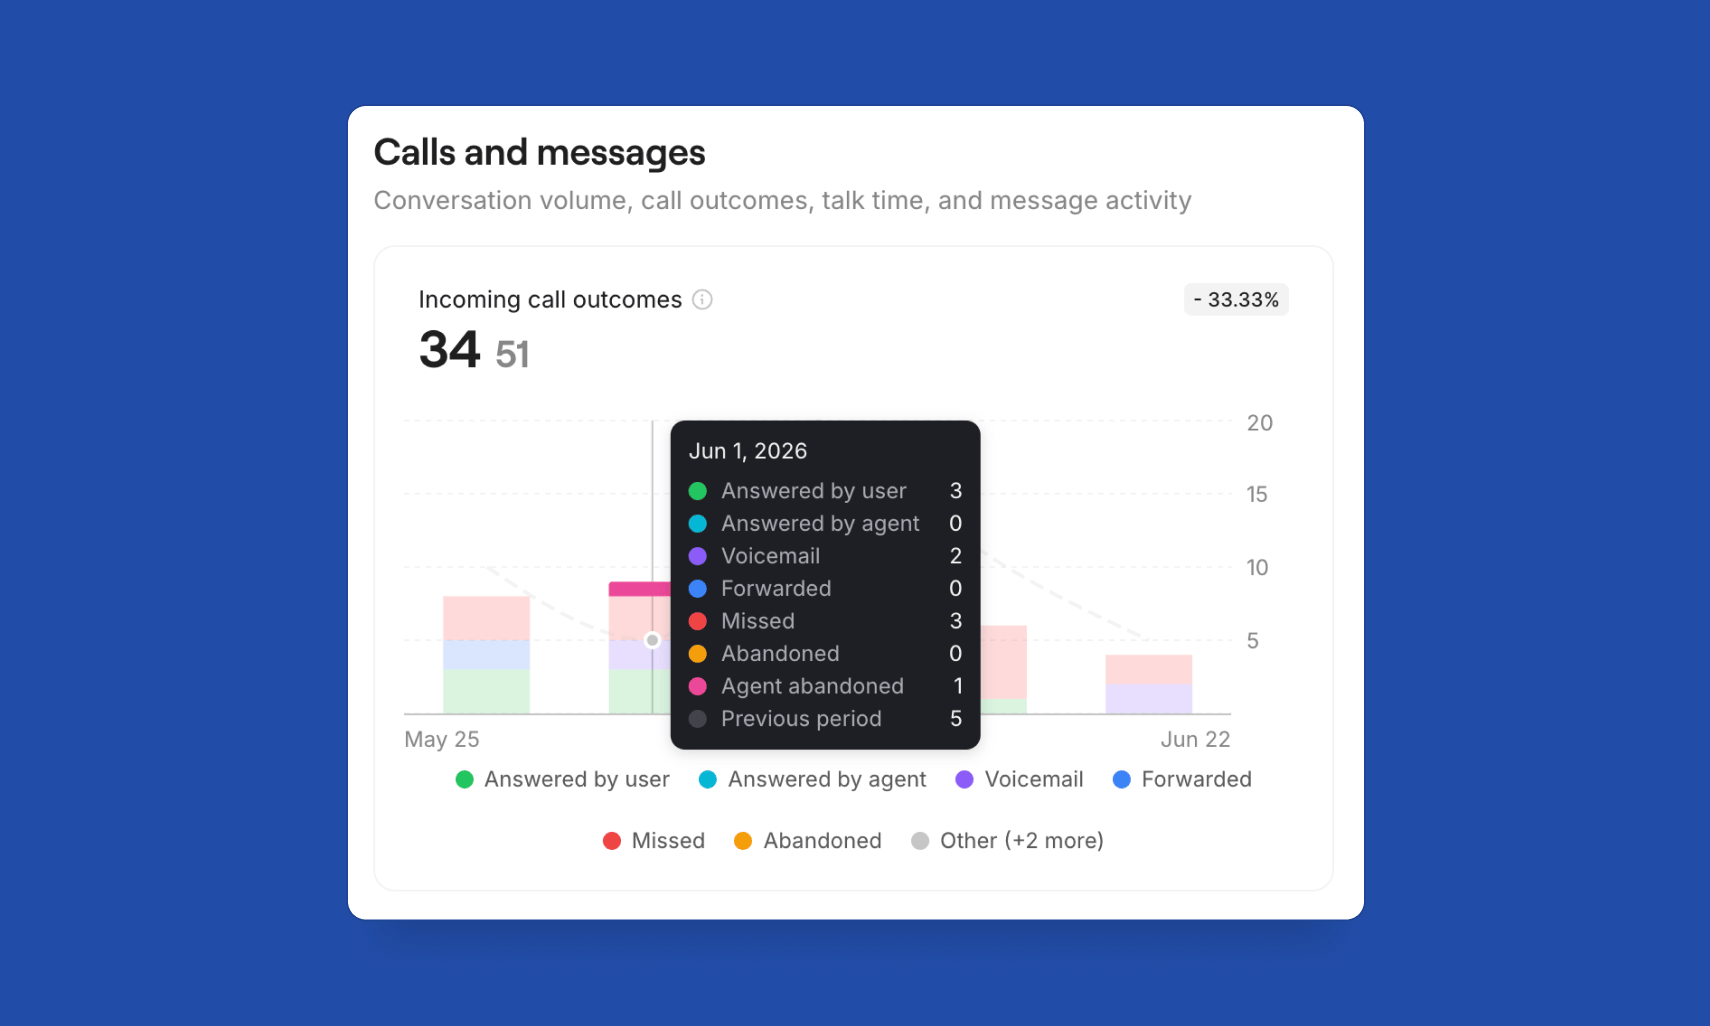
- Answered by teammate — connected to a member of your team
- Answered by AI agent — connected to an AI agent and held a meaningful conversation (10 seconds or more of talk time)
- Agent abandoned — reached an AI agent but the caller hung up in under 10 seconds (often indicates the caller wanted a human)
- Forwarded — routed to an external number
- Voicemail — the caller left a voicemail
- Abandoned — the caller hung up before anyone or anything answered
- Missed — rang through but was never picked up
- Connected — the recipient answered
- No answer — rang but went unanswered
- Busy — the line was busy
- Canceled — your teammate ended the call before it connected
- Failed — the call could not be placed (e.g. invalid number, carrier rejection)
Messages
Messages are reported by direction, not by delivery status:- Messages received — total inbound messages
- Messages sent — total outbound messages
Drilling into the underlying activity
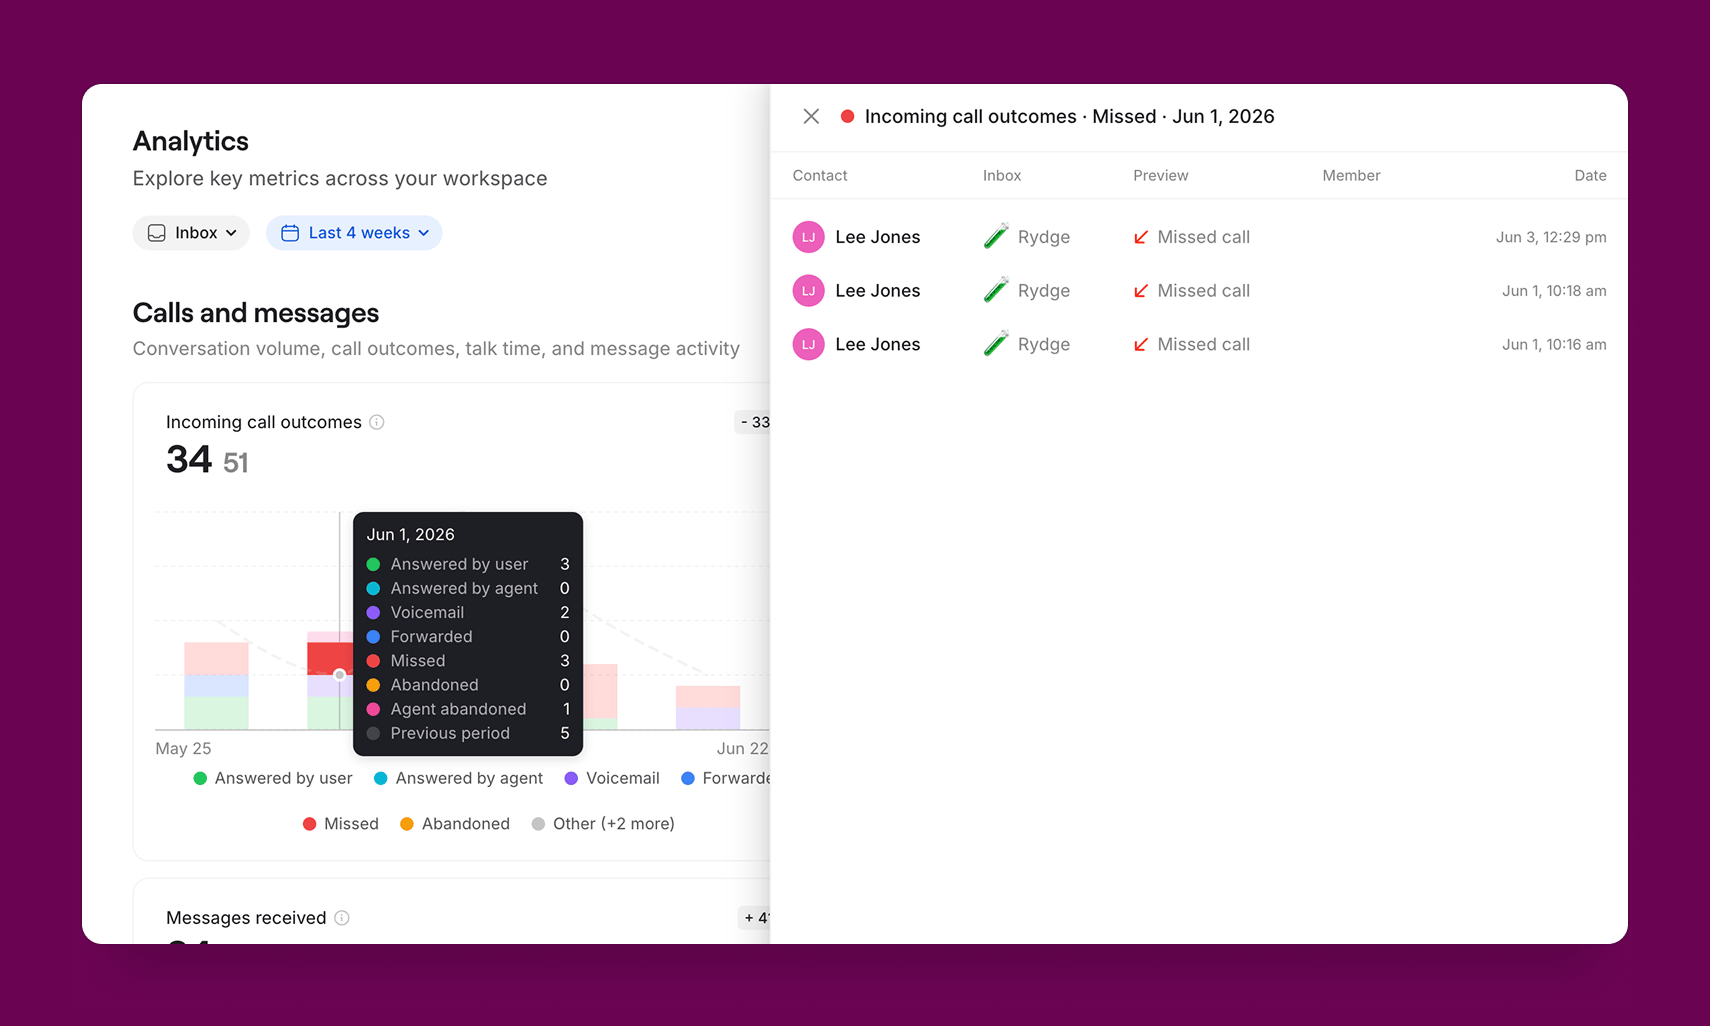
From any chart or metric tile in the dashboard, you can click a bar, segment, or tile to open a side panel listing the individual calls and messages behind the number. Each row shows the contact, the inbox the activity happened in, a preview of the call or message, the teammate who handled it, and when it occurred. This makes it easy to:- Spot-check a metric that looks off
- Pull up the exact calls that were tagged a certain way
- Investigate a spike in missed or abandoned calls
- See which inbox specific calls or messages came through
Common use cases
Performance optimization
Team management
Team management
- Identify top performers and training opportunities
- Balance workload distribution across team members
- Set performance benchmarks and track improvements
- Monitor response times and call completion rates
Operational insights
Business intelligence
Business intelligence
- Optimize staffing during peak communication times
- Identify customer contact patterns and preferences
- Track service level agreements and response metrics
- Analyze communication trends for business planning
Reporting and compliance
Documentation purposes
Documentation purposes
- Generate reports for management and stakeholders
- Track compliance with communication policies
- Maintain records for audit and review purposes
- Export data for integration with business intelligence tools
FAQs
Who can access analytics in Quo?
Who can access analytics in Quo?
- Owners and Admins can view analytics for all phone numbers.
- Members can only view data for numbers they’re assigned to.
Can I see historical data after upgrading my plan?
Can I see historical data after upgrading my plan?
What data can I export from analytics?
What data can I export from analytics?
Is analytics available on mobile?
Is analytics available on mobile?
How do I use the heat map to improve scheduling?
How do I use the heat map to improve scheduling?
Can I filter analytics by ring group or call flow?
Can I filter analytics by ring group or call flow?
Can I separate calls handled by AI agents from calls handled by my team?
Can I separate calls handled by AI agents from calls handled by my team?
How do I see which topics my team handles most?
How do I see which topics my team handles most?
What does a high number of very short calls (under 10 seconds) mean?
What does a high number of very short calls (under 10 seconds) mean?
How far back does analytics data go? Is there a retention limit?
How far back does analytics data go? Is there a retention limit?
I exported my analytics but haven't received the CSV email. What should I do?
I exported my analytics but haven't received the CSV email. What should I do?
What's the difference between the Analytics CSV and the Data Export feature?
What's the difference between the Analytics CSV and the Data Export feature?
- Analytics CSV (from the Analytics dashboard) exports performance metrics: call volume, message counts, timestamps, and team activity. Analytics doesn’t include message content or call recordings. If you need that, use Data Export.
- Data Export feature (Settings > Export) exports raw workspace data including contact lists, message logs, and call logs for compliance or backup. Only workspace Owners or Admins can run a full data export, while Owners and Admins can export analytics.
What does the statusDetails column in the CSV mean?
What does the statusDetails column in the CSV mean?
- Team member: Call was answered by a person
- Sona: Call was handled by Sona
- Abandoned: The caller hung up before anyone answered
- Unanswered: The call rang to the end of your call flow without being answered
Why do I see both call statuses and message statuses in the same status column?
Why do I see both call statuses and message statuses in the same status column?
- Call statuses include: completed, missed, cancelled, in-progress, forwarded, and ringing.
- Message statuses include: received, delivered, undelivered, and sent.
Some of my missed calls aren't showing up when I filter by person
Some of my missed calls aren't showing up when I filter by person
Can I compare my team's activity to a previous period?
Can I compare my team's activity to a previous period?